This assignment asks you to once again organize, and then share, your thinking in a visual way.
Why are we doing this?
I have taught students in many disciplines to write traditional papers. Many of these students have thought of themselves as linear, logical thinkers: people who can read or otherwise take in information, make an outline from it, and write a thoughtful, well-organized paper.
When I’m teaching students in a face-to-face class, however, I ask them to think a bit differently. I bring in large sheets of paper, colorful markers, and lots of sticky notes and ask the students to organize their thinking visually. At first, the students feel stymied, but once they dive in, they discover new things about their topics as they create, place, rearrange, and sketch lines and shapes around their sticky notes. They share with other students in the class and suggest changes to one another. By the end of the class period, most of the students—even those who began completely frustrated with the exercise—are thankful they had the opportunity and are eager to use it in their other courses.
As I mentioned above, you likely have considered yourself a linear, logical, analytical thinker. I’m guessing that’s less because you actually are one than because our schooling tends not to reward, or even give us much time to explore or practice, visual or spatial thinking. However, as you will learn from watching the video below, you are more likely to be a spatial thinker than an analytical thinker.
Before you go any further, watch this video—the entire video.
In it, graphic facilitator and spatial thinker extraordinaire Brandy Agerbeck explains how most people think, what we can do to escape overwhelm, organize our thinking, and craft new ideas:
I’m calling this assignment a “concept map,” but it’s much more than that.
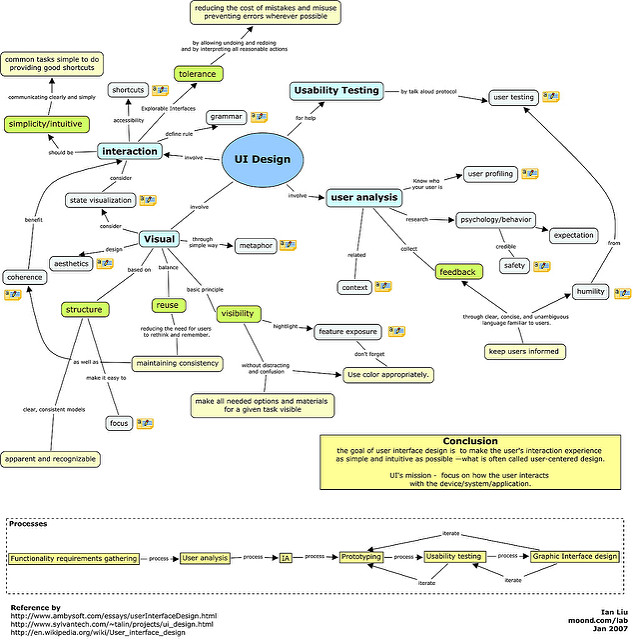
I’m calling it a “concept map” because the assignment asks you to grapple with, rethink, and represent/re-present (“map”) concepts from three weeks of our course (Modules 4-6). You, however, are not limited to creating a traditional concept map like the one below.

A traditional concept map. Photo by Ian Liu, and used under a Creative Commons license.
You can use any variety of two-dimensional print or digital visualization. You may find some inspiration at the Periodic Table of Visualization Methods. (Note that you can mouse over any of that table’s “elements” to see an example of the method it represents.)
So what is the assignment, anyway?
Step 1: Look back over the course materials, as well as your blog posts and notes, from Modules 4 through 6.
Step 2: Select a topic or concept that interests you and that applies to two or more modules. The topic/concept might not have been explicitly discussed in our course materials or blog posts; it might be something you noticed but didn’t get a chance to explore.
Step 3: Use Agerbeck’s technique to craft some kind of visual representation of your thinking about this concept. Create a draft concept map or other visual representation.
Step 4: Look over your draft. What cultural habits, beliefs, or values are emerging in it, or are suggested by it? Can you identify similarities or differences across cultures? Go beyond comparing and contrasting; what do these similarities and differences reveal or suggest?
Step 5: Revise your draft—at least once, but likely three or more times—into a visual representation of your ideas that is coherent to others.
Step 6: Write a paragraph or two explaining your concept map/visualization. Be sure to include a discussion of the habits, beliefs, and/or values you uncovered.
Step 7: Take a photo or screenshot of your visualization and share it, along with your paragraph(s), to the class blog by 11 p.m. on Saturday, February 27.
Feeling stuck?
Some tips:
Look back over the course materials to brainstorm topics. Topics covered that you may not have considered exploring include, but are not limited to:
- urban planning: Paris catacombs, San Francisco’s cemetery removal, design and alignment of Macchu Picchu
- domes: Hagia Sophia, Taj Mahal. How do they work? What do they evoke? Why domes?
- architectural elements: the basilica of the Hagia Sophia vs. the shapes of Aztec or Incan temples—and what they reveal about those cultures
- inscriptions: calligraphy in the Hagia Sophia and the Taj Mahal vs. carvings in Central and South American sacred structures
- interment of/treatment of the dead: Parisians, San Franciscans, Incas, Aztecs
If you’d find it useful, use Prown’s method of material cultural analysis (see Module 2.2) on elements of structures. For example, his method might help you understand what San Francisco’s repurposing of grave markers as curbs and in retaining walls reveals about the culture in that place and at that cultural moment.
Find a large horizontal or vertical surface on which to brainstorm.
- Use a whiteboard in a classroom between classes.
- Go to the MakerLab (first floor of Albertsons Library, turn right at the reference desk), which has an entire wall on which you can write with dry-erase markers provided by the MakerLab. (Tip: bring sticky notes!)
- Come to my office hours for help; we can use my office whiteboard.
- Spread out sticky notes or bits of paper on a horizontal surface: your floor, your kitchen table, a table in the library or the SUB or ILC.
- Tape together two or more pieces of 8.5″ x 11″ paper to create a larger workspace.
- If you can afford to spend a few dollars, buy yourself a new box of markers—those cheap Crayola or Rose Art ones are fine; you don’t need to spring for fancy art markers. There are few things more promising and inspiring than a box of brand-new markers.
Grading rubric
You can download the rubric for this assignment as either a Word doc (.docx) or PDF.
As always, I’m here to help.
E-mail me, call me, or stop by my office hours.